We aim to increase our corporate value and solve social issues simultaneously. Therefore, with respect to key performance indicators (KPIs) / targets, we are addressing to achieve both financial and non-financial aspects with the same amount of importance. Major Non-Financial Information, Non-financial information KPIs / targets and results, are shown below.
Results for KPIs are shown from the year they were set as KPIs and indicated as a "—(dash)" for earlier years.
Major Non-Financial Information
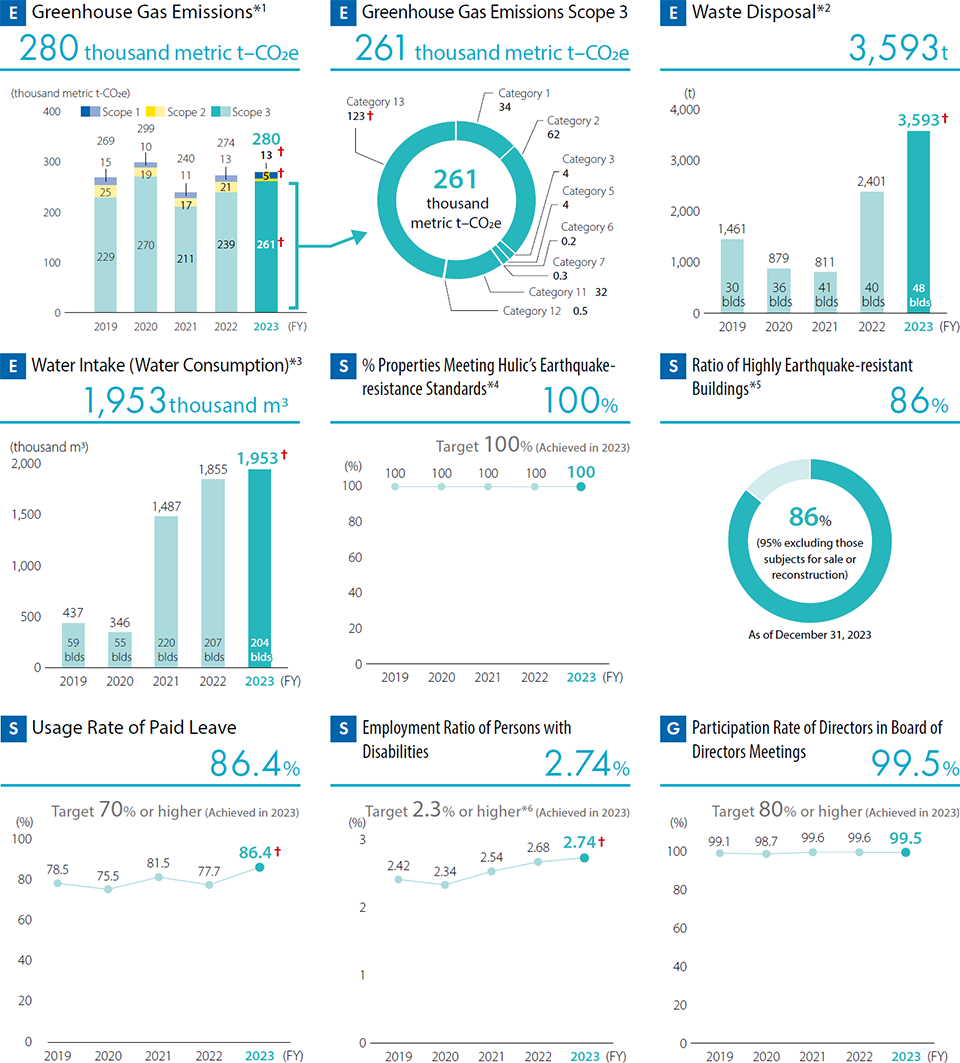
- *1We are calculating greenhouse gas emissions based on the GHG Protocol. Calculations for Scopes1 and 2 are based on the properties where the Hulic Group occupies or manages business operations (36 properties in FY2020, 41 properties in FY2021, 40 properties in FY2022, 48 properties in FY2023, 262 properties in FY2024, and 321 properties in FY2025 (This includes emissions from buildings occupied by KOKEN BORING MACHINE CO., LTD., while excluding emissions generated from its operational activities.)). In addition, properties held at the end of term are subject to the calculation (Properties acquired during the reporting year for the period from the acquisition date to the end of the term are included). In FY2024 and FY2025, the number of properties increased compared to the previous year due to the implementation of M&A during the period. The unit calorific values and the emission factors are based on values in the Act on the Rational Use of Energy and the Act on Promotion of Global Warming Countermeasures. Until FY2020, greenhouse gas emissions from one hotel operated by a subsidiary were calculated based on our ownership ratio in that property, but starting in FY2021, emissions are calculated based on operational control. The boundary and calculation method for Scope3 are disclosed on our website: https://www.hulic.co.jp/en/sustainability/ecology/warming/pdf/scope3.pdf GHG emissions quantification is subject to uncertainty when measuring activity data, determining emission factors, and considering scientific uncertainty inherent in the Global Warming Potentials.
- *2Calculations for waste disposal are based on the properties where the Hulic Group occupies or manages business operations (36 properties in FY2020, 41 properties in FY2021, 40 properties in FY2022, 48 properties in FY2023, 262 properties in FY2024, and 321 properties in FY2025). In FY2024 and FY2025, the number of properties increased compared to the previous year due to the implementation of M&A during the period. Beginning in FY2020, we are calculating total waste disposal at specific properties within the boundary by using weight conversion factors based on actual measurements. The waste disposal of certain properties are estimated using the total floor area based on the emissions intensity of buildings with similar functions.
- *3Beginning in FY2021, Hulic's fixed assets are covered, excluding properties under development and land for lease (220 properties in FY2021, 207 properties in FY2022, 204 properties in FY2023, 194 properties in FY2024, and 192 properties in FY2025). Note that the amount of hot spring water used at hot spring ryokans (luxury Japanese inns) is not included.
- *4Hulic’s earthquake-resistance standards are where building performance can safeguard human life and enable continued use of the building with post-earthquake repair in the event of an earthquake with a seismic intensity of level 7.
- *5Highly earthquake resistant buildings are those that can safeguard human life and enable continued use of the building with post-earthquake repairs when an earthquake hits with a seismic intensity of level 7, excluding those subjects for sale, etc.
- *6Our target for the employment ratio of persons with disabilities is to be at the statutory employment ratio or higher: 2.2% or higher till FY2020, 2.3% or higher from FY2021 to FY2023, and 2.5% or higher from FY2024 onward.
Key Performance Indicators (KPIs) /Targets and Results for Non-financial Information
| Hulic's Materiality | KPIs / Short-Term Targets, Medium- to Long-Term Targets | Coverage | 2021 results | 2022 results | 2023 results | 2024 results | 2025 results | Unit | Assessment*13 |
|---|---|---|---|---|---|---|---|---|---|
 Providing safe, secure buildings and spaces |
Percentage of properties meeting Hulic's earthquake-resistance standards*1: 100% each year | All completed properties each year | 100% (8 properties in boundary) |
100% (4 properties in boundary) |
100% (10 properties in boundary) |
100% (8 properties in boundary) |
100% (7 properties in boundary) |
% | ◎ |
| Progress toward a 100% highly earthquake resistant buildings*2 by 2029 | Hulic-owned fixed assets | — | 82% | 86% | 86% | 91% | % | ○ | |
 Contributing to actions for mitigating climate change and reducing our environmental impact |
Greenhouse gas emission reduction targets*3(base year: 2019) By 2030 Scope1+2 70%, Scope3 30% By 2050 Scope1+2, Scope3 substantially zero (Base year 2019: Scope1 14,931, Scope2 25,067, Scope1+2 39,997, Scope3 229,006) |
Scope1+2 Properties where the Hulic Group occupies or manages business operations*3 Scope3 Indirect emissions other than Scope1 and 2 related to Hulic Group’s business activities*3 |
Scope111,369 | Scope113,151 | Scope113,259 | Scope113,869 | Scope116,191 | metric t-CO2e | ○ |
| Scope217,473 | Scope220,966 | Scope25,105 | Scope2148 | Scope280 | |||||
| Scope1+228,842 | Scope1+234,118 | Scope1+218,364 | Scope1+214,017 | Scope1+216,271 | |||||
| Scope3210,703 | Scope3239,397 | Scope3261,152 | Scope3264,530 | Scope3333,258 | |||||
| Number of renewable energy systems installed in development/reconstruction projects: 3 or more every year | All completed properties each year | 8 | 3 | 3 | 5 | 3 | property | ◎ | |
| Waste emission reduction target: Each year less than 11 kg/m2 in terms of basic unit | Hulic Head Office Building and Hulic Annex | — | — | 9.6 | 10.0 | 8.3 | kg/m2 | ◎ | |
| Waste disposal: No numerical target (follow-up item) | Properties where the Hulic Group occupies or manages business operations*4 | 811 | 2,401 | 3,593 | 3,781 | 4,058 | metric tonnes | — | |
| Percentage of technical measures (such as longer life design, etc.)*5 applied to reduce construction waste: 100% each year | All completed fixed assets each year | 100% (8 properties in boundary) |
100% (4 properties in boundary) |
100% (10 properties in boundary) |
100% (8 properties in boundary) |
100% (7 properties in boundary) |
% | ◎ | |
| Water intake (water consumption): No numerical target (follow-up item) | Hulic-owned fixed assets*6 | 1,487 | 1,855 | 1,953 | 1,739 | 1,613 | thousand m3 | — | |
| Water intake (water consumption): Water-saving fixture installation rate: 100% each year | All completed fixed assets each year (excluding residential) | — | — | 100% (9 properties in boundary) |
100% (8 properties in boundary) |
100% (192 properties in boundary) |
% | ◎ | |
| Number of greening projects*7: 1 or more each year | All completed properties each year | 6 | 3 | 2 | 6 | 1 | property | ◎ | |
| Number of times climate change risks are monitored by the Sustainability Committee: 1 or more each year Number of times reports are submitted to the Board of Directors: 1 or more each year |
Hulic Co., Ltd. | 1/2 | 1/3 | 1/3 | 2/2 | 3/2 | time | ◎ | |
 Collaborating with business partners and local communities |
Number of customer satisfaction surveys: 1 or more each year | Hulic Group | 1 | 1 | 1 | 1 | 1 | time | ◎ |
 Promoting diversity and the development of professional human resources |
Percentage of employees who received medical checkups*8: 100% each year | Hulic Co., Ltd. | 100% | 100% | 100% | 100% | 100% | % | ◎ |
| Usage rate of childcare leave*9: female/ male employees 100% each year | Hulic Co., Ltd. | 100%/— | 100%/— | 100%/125% | 100%/88.9% | 100%/100% | % | ◎ | |
| Ratio of employees returning to work after childcare leave: 100% each year | Hulic Co., Ltd. | 100% | 100% | 100% | 100% | 100% | % | ◎ | |
| Usage rate of paid leave*10: 70% or higher each year | Hulic Co., Ltd. | 81.5% | 77.7% | 86.4% | 83.3% | 81.2% | % | ◎ | |
| Percentage of career development interviews conducted: 100% every year (conducted twice a year) | Hulic Co., Ltd. | 100% | 100% | 100% | 100% | 100% | % | ◎ | |
| Ratio of female managers: 30% by 2029 | Hulic Co., Ltd. | 22.4% | 21.5% | 18.3% | 20.2% | 21.5% | % | ○ | |
| Employment percentages of persons with disabilities: Maintaining the statutory employment ratio or higher (2.2% or higher till FY2020, 2.3% or higher from FY2021 to FY2023, and 2.5% or higher for FY2024 onward.) | Hulic Group*11 | 2.54% | 2.68% | 2.74% | 3.01% | 2.69% | % | ◎ | |
 Maintaining and improving governance trusted by stakeholders |
Participation rate in Board of Directors meetings: 80% or higher each year | Hulic Co., Ltd. | 99.6% | 99.6% | 99.5% | 100% | 99.2% | % | ◎ |
| Number of effectiveness assessment of the Board of Directors: once each year | Hulic Co., Ltd. | 1 | 1 | 1 | 1 | 1 | time | ◎ | |
| Number of compliance training conducted: 5 times each year (4 times for employees and once for officers) | Hulic Co., Ltd. | 5 (4 employees, 1 officer) |
5 (4 employees, 1 officer) |
5 (4 employees, 1 officer) |
7 (5 employees, 2 officer) |
5 (4 employees, 1 officer) |
time | ◎ | |
| Number of Risk Management Committee and Fund and ALM Committee meetings: 4 times or more each year, respectively | Hulic Co., Ltd. | 4/16 | 4/17 | 4/16 | 4/16 | 4/14 | time | ◎ | |
| Number of BCP drills, inspections of stockpiled food and suppliers: 1 or more each year | Hulic Group | 3/4/1*12 | 3/4/1 | 2/4/4 | 3/4/4 | 5/4/4 | time | ◎ |
- *1Hulic’s earthquake-resistance standards are where building performance can safeguard human life and enable continued use of the building with post-earthquake repair in the event of an earthquake with a seismic intensity of level 7.
- *2Highly earthquake resistant buildings are those that can safeguard human life and enable continued use of the building with post-earthquake repairs when an earthquake hits with a seismic intensity of level 7, excluding those subjects for sale, etc.
- *3We are calculating greenhouse gas emissions based on the GHG Protocol. See Major Non-financial Information*1 for the boundary for Scope1 and Scope2. The boundary and calculation method for Scope3 are disclosed on our website: https://www.hulic.co.jp/en/sustainability/ecology/warming/pdf/scope3.pdf
- *4Calculations for waste disposal are based on the properties where the Hulic Group occupies or manages business operations (36 properties in FY2020, 41 properties in FY2021, 40 properties in FY2022, 48 properties in FY2023, 262 properties in FY2024, and 321 properties in FY2025). In FY2024 and FY2025, the number of properties increased compared to the previous year due to the implementation of M&A during the period. Beginning in FY2020, we are calculating total waste disposal at specific properties within the boundary by using weight conversion factors based on actual measurements. The waste disposal of certain properties are estimated using the total floor area based on the emissions intensity of buildings with similar functions.
- *5The percentage of properties completed in the given year that used technologies and measures that contributed to a reduction in waste as well as raw materials and other resources based on the Hulic Guidelines for Longer Life.
- *6Beginning in FY2021, Hulic's fixed assets are covered, excluding properties under development and land for lease (220 properties in FY2021, 207 properties in FY2022, 204 properties in FY2023, 194 properties in FY2024, and 192 properties in FY2025). Note that the amount of hot spring water used at hot spring ryokans (luxury Japanese inns) is not included.
- *7The number of completed non-current assets in each year among those buildings and facilities with a greening obligation.
- *8The executive officers, employees (including seconded staff ) and full-time contract staff who were with the Company at the time of application of medical checkup and as of December 31, were counted (excluding personnel who were on leave).
- *9Females calculated by dividing the number of employees who took maternity leave in the fiscal year by the number of employees who entered the period covered by maternity leave in the fiscal year and males calculated by dividing the number of employees who took paternity leave in the fiscal year by the number of employees whose spouses gave birth in the fiscal year.
- *10The usage rate of paid leave is calculated by dividing the number of days of paid leave used in the year by the number of days of paid leave granted in the year. The number of days carried over in the year are excluded.
- *11Limited to Hulic Co., Ltd. and subsidiary companies that have been certified as special subsidiary companies under the Act on Employment Promotion, etc. of Persons with Disabilities. The employment ratio for persons with disabilities is as of June 1 of each year.
- *12Beginning in FY2021, the number of BCP drills, inspections of stockpiled food and suppliers are disclosed, respectively.
- *13◎: achieved, ○: progressed, △: not progressed, —: not subject to assessment