Greenhouse Gas Emissions
Greenhouse Gas Emissions*1
- *1We are calculating greenhouse gas emissions based on the GHG Protocol. Calculations for Scope1 and 2 are based on the properties where the Hulic Group occupies or manages business operations (36 properties in FY 2020, 41 properties in FY2021, 40 properties in FY2022, 48 properties in FY2023, 262 properties in FY2024, and 321 properties in FY2025 (This includes emissions from buildings occupied by KOKEN BORING MACHINE CO., LTD., while excluding emissions generated from its operational activities.)). In addition, properties held at the end of term are subject to the calculation (Properties acquired during the reporting year for the period from the acquisition date to the end of the term are included). In FY2024 and FY2025, the number of properties increased compared to the previous year due to the implementation of M&A during the period. The unit calorific values and the emission factors are based on values in the Act on the Rational Use of Energy and the Act on Promotion of Global Warming Countermeasures. Until FY2020, greenhouse gas emissions from one hotel operated by a subsidiary were calculated based on our ownership ratio in that property, but starting in FY2021, emissions are calculated based on operational control. The boundary and calculation method for Scope3 are disclosed on this page. GHG emissions quantification is subject to uncertainty when measuring activity data, determining emission factors, and considering scientific uncertainty inherent in the Global Warming Potentials.
Greenhouse Gas Emissions
| Greenhouse Gas Emissions (t-CO2e)*1・*2 | |||||||
|---|---|---|---|---|---|---|---|
| 2019 (Base year) |
2021 | 2022 | 2023 | 2024 | 2025 | ||
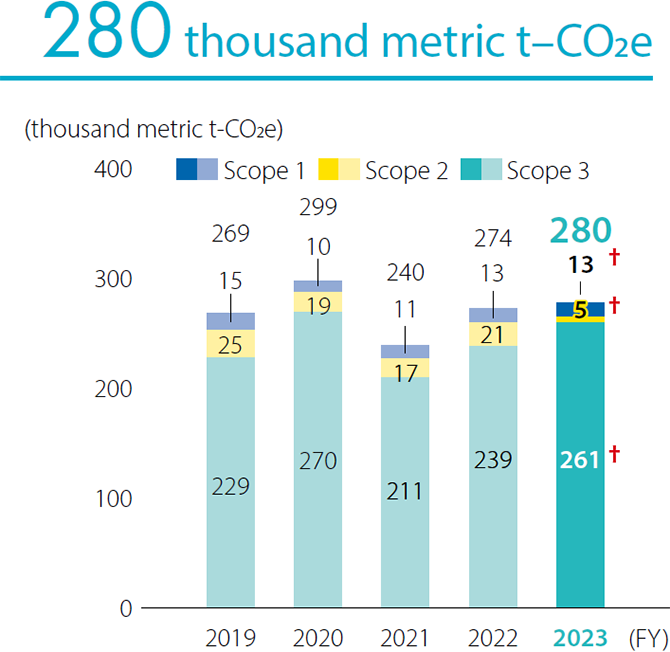
| Scope1 Direct Emissions | 14,931 | 11,369 | 13,151 | 13,259 | 13,869 | 16,191 | |
| Scope2 Indirect Emissions*3 (market based) | 25,067 | 17,473 | 20,966 | 5,105 | 148 | 80 | |
| Subtotal Scope1 and Scope2 | 39,997 | 28,842 | 34,118 | 18,364 | 14,017 | 16,271 | ←59% reduction compared to base year |
| Scope3 Indirect Emisssions | |||||||
| 1. Purchased goods and services | 18,303 | 24,497 | 33,122 | 34,218 | 45,182 | 54,254 | |
| 2. Capital goods | 20,730 | 19,638 | 30,727 | 62,327 | 67,300 | 117,963 | |
| 3. Fuel and energy related activites | 6,597 | 5,238 | 6,112 | 3,939 | 3,728 | 4,324 | |
| 4. Upstream transportation and distribution | — | — | — | — | — | — | |
| 5. Waste generated in operations | 2,276 | 1,419 | 3,016 | 4,497 | 2,101 | 2,809 | |
| 6. Business travel | 244 | 194 | 176 | 177 | 369 | 456 | |
| 7. Employee commuting | 455 | 283 | 307 | 338 | 695 | 802 | |
| 8. Upstream leased assets | — | — | — | — | — | — | |
| 9. Downstream transportation and distribution | — | — | — | — | — | — | |
| 10. Processing of sold products | — | — | — | — | — | — | |
| 11. Use of sold products | 36,984 | 43,315 | 33,033 | 32,417 | 19,471 | 34,623 | |
| 12. End of life treatment of sold products | 193 | 1,005 | 712 | 474 | 713 | 796 | |
| 13. Downstream leased assets | 143,225 | 115,114 | 132,191 | 122,765 | 124,973 | 117,232 | |
| 14. Francises | — | — | — | — | — | — | |
| 15. Investments | — | — | — | — | — | — | |
| Scope3 Categories 11 and 13 *4 |
180,209 | 158,429 | 165,224 | 155,182 | 144,443 | 151,855 | ←16% reduction compared to base year |
| Subtotal Scope3 | 229,006 | 210,703 | 239,397 | 261,152 | 264,530 | 333,258 | |
| Total | 269,004 | 239,545 | 273,514 | 279,516 | 278,547 | 349,529 | |
- —: Not applicable
- *1Hulic manages the amount of permissible leaks as an administrator based on the Act on Rational Use and Proper Management of Fluorocarbons and they are included in the calculations of greenhouse gas emissions. Note that we do not report or disclose this data as the amount of leaks is below the reporting standards.
- *2Our calculation of Greenhouse Gas Emissions adopts the criterion of operational control.
- *3Scope2 (Location based) FY2025 Result:29,197 t-CO2e
- *4Scope3 Target (approved by SBTi) is set for Categories 11 and 13.
Calculations of Greenhouse Gas Scope3 Emissions
Total Energy Consumption
(GJ)
| 2021 | 2022 | 2023 | 2024 | 2025 |
|---|---|---|---|---|
| 331,667 | 433,553 | 450,698 | 499,588 | 578,532 |
- *The boundary is the properties where the Hulic Group occupies or manages business operations (36 properties in FY2020, 41 properties in FY2021, 40 properties in FY2022, 48 properties in FY2023, 262 properties in FY2024, and 321 properties in FY2025 (This includes emissions from buildings occupied by KOKEN BORING MACHINE CO., LTD., while excluding emissions generated from its operational activities.)). In addition, properties held at the end of term are subject to the calculation (Properties acquired during the reporting year for the period from the acquisition date to the end of the term are included). In FY2024 and FY2025, the number of properties increased compared to the previous year due to the implementation of M&A during the period.
- *From FY2025, to align with international disclosure standards, the basis of calculation has been changed from primary energy consumption to secondary energy consumption. In line with this change, previously disclosed figures have been restated using secondary energy consumption.
Green Procurement Initiatives
Hulic is working to reduce environmental impacts throughout all of our operations, and we also ask our business partners to agree to the following green procurement policy and work together with them.
- To engage in energy-saving activities and reduce GHG emissions;
- To reduce the amount of water consumption as much as possible;
- To carry out a biodiversity-friendly business;
- To fully prevent environmental pollution; and
- To make efforts to save resources and reduce the amount of waste.